
AIMA 2026 projects ✦ Project VII ✦ Representation learning
Teaching AI to read the language of proteins in human tissue
Every cell in your body runs on proteins, yet today’s instruments see different halves of the story. Mass spectrometry measures thousands of proteins but loses where they were in the tissue; multiplexed imaging keeps the place but sees only a few dozen. We will teach AI one shared representation of both, and ask what it reveals about cells, tissues and patients.
In partnership with

 Harvard
Medical School
One tissue, two instruments, one representation
Tissue slide from the Deep Visual Proteomics workflow, Mund et al. 20221, CC BY 4.0. Imaging panel: human breast adenocarcinoma, PhenoCycler (CODEX), MMVODV, Wikimedia Commons, CC BY-SA 4.0. The spectrum is schematic.
The question
Every cell has a molecular story
Every cell in your body runs on proteins. Proteins decide what a cell does, how it responds to its surroundings, and how a tissue changes in disease. But today’s technologies see different halves of the same story.
From tissue to cells to proteins
Schematic drawn for this page; cells and proteins are not to scale.
Mass spectrometry sees what
Mass spectrometry measures thousands of proteins at once: about 2,500 in each single liver cell, in a map of hundreds of cells from 18 people2. But the sample has to leave the tissue, so where each protein sat is lost unless it is recorded first. Deep Visual Proteomics records it: it images the tissue, lets AI choose the cells, and cuts each one out with a laser before the measurement1.
Imaging sees where
Multiplexed imaging keeps every cell in place, with its shape and its neighbours, but stains for a panel of markers at a time: 35 in a study of 352 breast cancer patients3. Panels differ from study to study, which is why most methods stay tied to a single cohort4. The two views complement each other, and neither gives the whole picture.
Two instruments, two incomplete views
Illustrative: the tissue, the cell types and the protein profiles are simulated for this page. The six marker names are common imaging markers, shown as examples.
The central questionNot only whether we can build a shared representation, but what AI can learn about biology from the way proteins are organised in tissue.
- Who is here?Cell phenotyping
- Who is next to whom?Spatial niches and cellular neighbourhoods
- Which patients are biologically alike?Patient stratification
- Who is likely to respond to treatment?Treatment-response prediction
- What molecular signals can an image reveal?Virtual staining and virtual spatial proteomics
- What biological patterns have we missed?Biomarker and therapeutic discovery
The project
Connect what and where
Two encoders, one for the image of a cell and one for the proteome measured from that same cell, learn a common space. The representation is the means; understanding what it lets us see is the scientific goal.
One cell, two encoders, one shared map
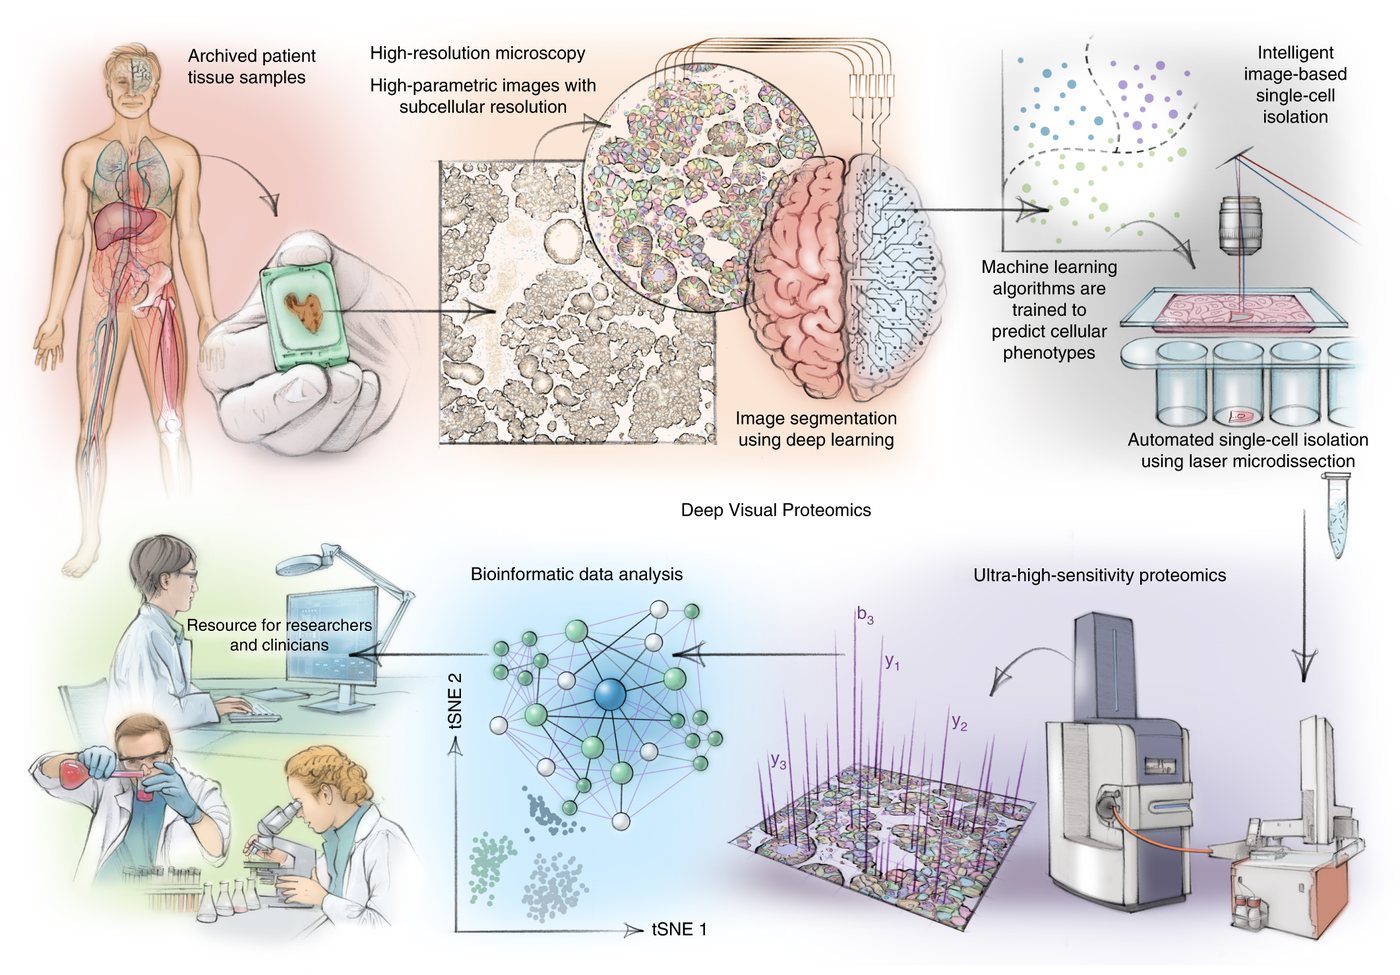
Workflow figure: Mund et al. 20221, Fig. 1, CC BY 4.0, shown unchanged. The encoders and the embedding are schematic; points are simulated.
For medicine
Hospitals already make enormous numbers of H&E slides. If AI can tie routine histology to deeper molecular information, ordinary slides become richer readouts. One model predicted 40 proteins from H&E and, across 2,298 lung cancer patients, improved prognosis by 22% and immunotherapy-response prediction by 24–39%5; another made virtual multiplex images for 14,256 patients6. How far towards the whole proteome can this go?
For science
Spatial foundation models learn powerful visual representations7,4, but a protein may still be an index, a sequence, or one of the few markers seen in training. Mass spectrometry adds what images lack: which proteins actually rise and fall together in real cells, mapped for 10,323 human proteins8. Can that knowledge help a model with proteins it has never seen in an image?
For biological understanding
How much of what a cell is doing can be seen in a picture, and what remains invisible?
In mouse liver, a model trained on paired data already inferred the spatial proteome from images alone9. The answer defines both the power and the limits of image-based biology.
One map for two views
Learn a shared representation of single-cell images and the proteomes measured from the same cells. Measure carefully what the image captures beyond a cell’s position, and what only mass spectrometry can see.
A dictionary for proteins
Teach imaging foundation models what a protein is, by learning protein representations from mass-spectrometry data, not only from sequence. The test: can the model understand proteins it has never seen in an image?
From the lab to the clinic
Carry the representation to routine H&E slides. Bulk mass spectrometry tells the model which proteins change between patients, and multiplexed images tell it where they live in the tissue.
Data
- Single-cell images paired with mass-spectrometry proteomes, human and mouse liver (Deep Visual Proteomics)2,9
- Imaging mass cytometry of breast cancer: 35 markers, 352 patients3
- Same-section H&E and high-plex immunofluorescence, colorectal cancer (Orion)10
- A proteome-wide co-regulation map (ProteomeHD)8 and breast cancer H&E slides with tumour proteomes (CPTAC)11
You will learn
- Representation learning: self-supervised and multimodal training, embeddings, transfer
- Working with real biomedical images and mass-spectrometry data, from raw files to models
- PyTorch at scale on a multi-GPU cluster, and experiment design that survives scrutiny
- Reading and writing papers where AI meets biology
Good fit if you
- Enjoy deep learning and want to apply it where it can change medicine
- Are curious why things work, not only whether they work
- Like careful evaluation as much as building models
- Have no biology background yet: that is fine, we will teach you what you need
Data & pairing
Align each cell’s image with its measured proteome and clean out confounders.
Encoders
Adapt pretrained image and protein models to spatial-proteomics data.
Representation
Learn the shared map; test it on proteins and slides it has never seen.
Evaluation
Benchmark against state-of-the-art foundation models with patient-level splits.
The plan · 6 months
From first paper to submission.
Six months, one question carried from paired single cells to routine pathology slides, with weekly group meetings and a monthly review with mentors.
Onboard
Read the core papers, set up the cluster, and load the paired image–proteome data.
Reproduce
Reproduce foundation-model baselines and measure what images reveal about the proteome.
Propose
Design the shared representation and the protein dictionary.
Iterate
Train, test on held-out proteins and datasets, and refine.
Validate
Transfer to H&E slides and check the predicted maps against measured images.
Submit
Write up the results and submit to a peer-reviewed venue.
Project VII · Representation learning
Want to work on
this question?
Apply through the form by November 7, 2026, choosing Project VII, with an academic CV and a statement of purpose of up to 300 words. Interviews run November 9 to 13, and groups start around November 18. Mentors from Florida International University · Harvard Medical School.
References
- Mund et al. Deep Visual Proteomics defines single-cell identity and heterogeneity. Nature Biotechnology 2022. DOI
- Weiss et al. Single-cell spatial proteomics maps human liver zonation patterns and their vulnerability to disruption in tissue architecture. Nature Metabolism 2026. DOI
- Jackson et al. The single-cell pathology landscape of breast cancer. Nature 2020. DOI
- Wenckstern et al. The Virtual Tissues foundation model resolves spatial proteomics across scales. Nature 2026. DOI
- Li et al. AI-enabled virtual spatial proteomics from histopathology for interpretable biomarker discovery in lung cancer. Nature Medicine 2026. DOI
- Valanarasu et al. Multimodal AI generates virtual population for tumor microenvironment modeling. Cell 2026. DOI
- Shaban et al. A Foundation Model for Spatial Proteomics. arXiv preprint 2025. arXiv
- Kustatscher et al. Co-regulation map of the human proteome enables identification of protein functions. Nature Biotechnology 2019. DOI
- Rosenberger et al. Spatial single-cell mass spectrometry defines zonation of the hepatocyte proteome. Nature Methods 2023. DOI
- Lin et al. High-plex immunofluorescence imaging and traditional histology of the same tissue section for discovering image-based biomarkers. Nature Cancer 2023. DOI
- National Cancer Institute Clinical Proteomic Tumor Analysis Consortium. The CPTAC Breast Invasive Carcinoma Collection (CPTAC-BRCA). The Cancer Imaging Archive 2020. DOI